import numpy as np
import matplotlib.pyplot as plt
import pandas as pd
from PIL import Image
%matplotlib inline
import tensorflow as tf
from tensorflow.keras.datasets import mnist
from tensorflow.keras.models import Sequential
from tensorflow.keras.layers import Dense, Dropout, Activation
from tensorflow.keras.optimizers import Adam
from tensorflow.keras.utils import to_categorical(X_train, y_train), (X_test, y_test) = mnist.load_data()데이터 모양 확인
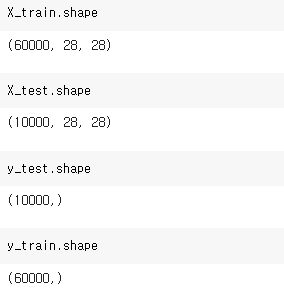
28행 28열
데이터 일렬로 만들기
X_train = X_train.reshape(60000,784)
X_test = X_test.reshape(10000,784)
float으로 바꾸고 정규화 시켜주기
X_train = X_train.astype(float)
X_test = X_test.astype(float)
X_test = X_test / 255.0
X_train = X_train / 255.0
인코딩
https://seonggongstory.tistory.com/154
tf.keras.utils.to_categorical 원핫 인코딩으로 바꾸기
넘파이의 레이블 인코딩된 값을 ,원핫 인코딩으로 바꾸는 법 텐서플로우 기본 제공한다. tf.keras.utils.to_categorical(y_train,num_classes=컬럼수)
seonggongstory.tistory.com
y_train = tf.keras.utils.to_categorical(y_train,num_classes=10)
y_test = tf.keras.utils.to_categorical(y_test,num_classes=10)
모델링
def build_model() :
  model = Sequential()
  model.add( Dense(512  , 'relu'  , input_shape=(784,)  )  )
  model.add( Dropout(0.4))
  model.add( Dense(10,'softmax')    )
  model.compile('adam',loss='categorical_crossentropy',  metrics=['accuracy'])
  return model
https://seonggongstory.tistory.com/133
딥러닝 하이퍼 파라미터 용어: optimizer 와 손실함수(loss function)
Loss Function(손실함수) 손실 함수란 실제값과 예측값의 차이(loss, cost)를 수치화해주는 함수이다. 오차가 클수록 손실 함수의 값이 크고, 오차가 작을수록 손실 함수의 값이 작아진다. 손실 함수의
seonggongstory.tistory.com
loss펑션 다른점 확인
학습
model = build_model()
epoch_history = model.fit(X_train,y_train,epochs=5,validation_data=(X_test,y_test) )
평가
model.evaluate(X_test,y_test)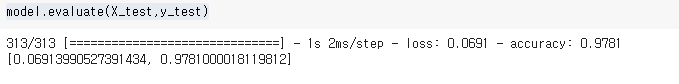
컨퓨전 매트릭스와 히트맵
https://seonggongstory.tistory.com/150
레이블인코딩으로 변환( argmax ): Classification metrics can't handle a mix of multilabel-indicator and continuous-mult
y_pred.argmax(axis=1) 요런 모양에서 다시
seonggongstory.tistory.com
from sklearn.metrics import confusion_matrix
y_pred = model.predict(X_test)
y_pred =  y_pred.argmax(axis=1)
y_test = y_test.argmax(axis=1)
cm = confusion_matrix(y_test,y_pred)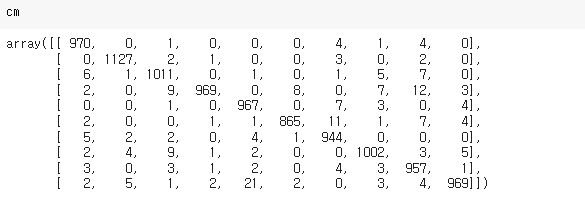
import seaborn as sb
sb.heatmap(cm,annot=True, fmt='.0f', cmap='RdPu')
plt.show()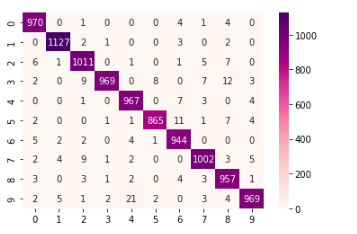
'파이썬 > 텐서플로우' 카테고리의 다른 글
| Tensorflow CNN 이미지분류 모델링하기: (0) | 2022.12.30 |
|---|---|
| tf.keras.utils.to_categorical 원핫 인코딩으로 바꾸기 (0) | 2022.12.29 |
| 완성한 인공지능 model , 네트워크 , weight 저장 하는 방법 (0) | 2022.12.29 |
| Tensorflow 이미지분류(ANN) 모델링시 flatten 사용안하고 모델링하기 (0) | 2022.12.29 |
| Tensorflow Callback class를 이용한 오버피팅 방지 (0) | 2022.12.29 |