우리나라 시도별,나이별 인구수데이터프레임을 불러와 데이터분석을 할때
특정 도시에서 x축에 나이, y축에 사람수의 plot 차트를 만드려고 하는 상황
plt.plot(x,df2)---------------------------------------------------------------------------
TypeError Traceback (most recent call last)
Cell In [19], line 1
----> 1 plt.plot(x,df2)
File ~\anaconda3\envs\YH\lib\site-packages\matplotlib\pyplot.py:2767, in plot(scalex, scaley, data, *args, **kwargs)
2765 @_copy_docstring_and_deprecators(Axes.plot)
2766 def plot(*args, scalex=True, scaley=True, data=None, **kwargs):
-> 2767 return gca().plot(
2768 *args, scalex=scalex, scaley=scaley,
2769 **({"data": data} if data is not None else {}), **kwargs)
File ~\anaconda3\envs\YH\lib\site-packages\matplotlib\axes\_axes.py:1635, in Axes.plot(self, scalex, scaley, data, *args, **kwargs)
1393 """
1394 Plot y versus x as lines and/or markers.
1395
(...)
1632 (``'green'``) or hex strings (``'#008000'``).
1633 """
1634 kwargs = cbook.normalize_kwargs(kwargs, mlines.Line2D)
-> 1635 lines = [*self._get_lines(*args, data=data, **kwargs)]
1636 for line in lines:
1637 self.add_line(line)
File ~\anaconda3\envs\YH\lib\site-packages\matplotlib\axes\_base.py:312, in _process_plot_var_args.__call__(self, data, *args, **kwargs)
310 this += args[0],
311 args = args[1:]
--> 312 yield from self._plot_args(this, kwargs)
File ~\anaconda3\envs\YH\lib\site-packages\matplotlib\axes\_base.py:495, in _process_plot_var_args._plot_args(self, tup, kwargs, return_kwargs)
493 self.axes.xaxis.update_units(x)
494 if self.axes.yaxis is not None:
--> 495 self.axes.yaxis.update_units(y)
497 if x.shape[0] != y.shape[0]:
498 raise ValueError(f"x and y must have same first dimension, but "
499 f"have shapes {x.shape} and {y.shape}")
File ~\anaconda3\envs\YH\lib\site-packages\matplotlib\axis.py:1449, in Axis.update_units(self, data)
1447 neednew = self.converter != converter
1448 self.converter = converter
-> 1449 default = self.converter.default_units(data, self)
1450 if default is not None and self.units is None:
1451 self.set_units(default)
File ~\anaconda3\envs\YH\lib\site-packages\matplotlib\category.py:116, in StrCategoryConverter.default_units(data, axis)
114 # the conversion call stack is default_units -> axis_info -> convert
115 if axis.units is None:
--> 116 axis.set_units(UnitData(data))
117 else:
118 axis.units.update(data)
File ~\anaconda3\envs\YH\lib\site-packages\matplotlib\category.py:192, in UnitData.__init__(self, data)
190 self._counter = itertools.count()
191 if data is not None:
--> 192 self.update(data)
File ~\anaconda3\envs\YH\lib\site-packages\matplotlib\category.py:225, in UnitData.update(self, data)
223 # check if convertible to number:
224 convertible = True
--> 225 for val in OrderedDict.fromkeys(data):
226 # OrderedDict just iterates over unique values in data.
227 _api.check_isinstance((str, bytes), value=val)
228 if convertible:
229 # this will only be called so long as convertible is True.
TypeError: unhashable type: 'numpy.ndarray'


2019년 7월 _99세 데이터만 int로 인식하고 나머진 object로 인식하고 있는 상황
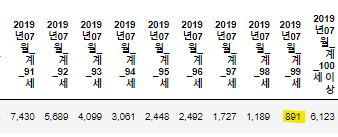
사람이 숫자 표기하는 방식인 1000단위마다 , 가 있기때문에 이를 그대로 활용해서 object가 되었음
df.loc[ df['행정구역'].str.contains('삼청동'), '2019년07월_계_0세' : '2019년07월_계_100세 이상'
df.loc[ df['행정구역'].str.contains('삼청동'), '2019년07월_계_0세' : '2019년07월_계_100세 이상' ].valuesarray([['7', '9', '13', '12', '11', '11', '9', '11', '20', '18', '18',
'23', '23', '19', '17', '16', '20', '25', '25', '27', '22', '35',
'34', '29', '42', '38', '38', '32', '31', '36', '53', '32', '29',
'42', '45', '29', '45', '50', '45', '52', '43', '36', '34', '29',
'35', '33', '41', '37', '46', '48', '44', '47', '33', '46', '41',
'40', '44', '57', '47', '49', '52', '45', '45', '44', '49', '35',
'40', '37', '18', '28', '34', '40', '29', '24', '27', '25', '27',
'36', '24', '27', '17', '18', '16', '19', '16', '12', '14', '10',
'11', '9', '1', '6', '6', '2', '3', '1', '1', '2', '1', 1, '7']],
dtype=object)어레이된 데이터들이 전부 ' ' 안에 있는걸 확인
type자체가 object로 인식을 하고 있음
해결
df = pd.read_csv('../data/age.csv' , encoding='cp949', thousands = ',')처음부터 불러올때 천단위마다 있는 , 를 빼고 다시 불러오기

이제 int로 인식할수 있음.
'오류' 카테고리의 다른 글
| ec2 private한 repository clone 및 pull (0) | 2022.12.21 |
|---|---|
| ec2 서버 실행시 bash: syntax error near unexpected token `(' (0) | 2022.12.21 |
| moduleNotFoundError (0) | 2022.11.29 |
| csv 불러오기 유니코드 오류 (0) | 2022.11.28 |
| 넘파이 액세스 boolean 연산중 오류 (0) | 2022.11.23 |